
Author:
- Name: Francois Boutines
Location: FR - French Republic (France)
To build:
makeYou will need an SVG viewer or
a converter like ImageMagick’s convert.
See the FAQ on “ImageMagick” for more details and
this list of SVG Viewer
Implementations,
should you need more help.
To use:
./boutines < input > output.svgTry:
./try.shIf ruby is installed try.sh will generate an SVG file by:
ruby -e '20.times{puts "#{rand} #{rand}"}' | ./boutines > test.svgIt will also create an SVG file with the file input.txt.
The script will check if convert is available and if so it will try converting
the SVG file(s) to PNG file(s) which you should be able to view in most any
graphics viewer, editor or web browser.
If you have a program that opens
SVG files then you could open
the test.svg and result.svg files directly. An example program is
Inkscape. See the
list cited above for
others.
Judges’ remarks:
Can you explain the author’s remark “[generated files] are not as scalable as their name suggests”?
Author’s remarks:
In memory of my father Pierre Boutines-Vignard.
Walk-through
My program works as follows:
Input
A list of 2D points in the unit square.
Output
A Voronoi diagram of the set as an SVG stream.
This will possibly save a compressed SVG file and may be useful:
./boutines | gzip > result.svg.gzInput consists of a list of floating points values separated by whitespaces
(ranging preferably in [0,1]). Alternating a horizontal coordinate, a
whitespace then the other coordinate (pointing downwards in the resulting
graph) and a newline will just go fine:
    0  0
    0  1
    1  0
    1  1
    .5 .5
Strictly speaking, you have to provide a set of points. If there are duplicates in the list, there is no guarantee on the one to be shown (and in addition their labels will overlap) in the resulting colored Voronoi diagram.
Caution
This program might have been a lot shorter, but nearly impractical even for medium sized datasets. On the other hand it could have been a lot faster, but hard to qualify under the IOCCC size limit. So guess what I did? A compromise favoring innermost obfuscation, sacrificing sometimes speed and other tedious factors.
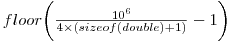
Therefore this entry is limited to
![]()
points and won’t even be suitable for more than a few thousand; although generated files did pass the W3C SVG Validator, and are highly compressible, they are not as scalable as their name suggests… For serious applications about Voronoi diagrams, see Qhull, CGAL and the like but you may still encounter large output volumes (and have to handle some sort of clipping in order to represent properly infinite regions of the diagram in SVG.
Beware, compilation may report warnings about precision loss, linting may be a
disaster, but the code should remain portable, and the output accurate enough
for most devices (including many inkjet printers). If you ever miss precision
on a particular dataset or peripheral, you may want to dive in and let U be
the next power of __LINE__.
NOTE: bad inputs will be sanctioned by the production of the 42nd Mersenne
prime (i.e. 2^25964951 -1);
memory will be kept.
Why I think this code is Obfuscated ?
I’m quite divided on the subject because I wrote:
- Clear SVG keywords but complicated output statements.
- No nested loops but loads of function calls.
- Easy recursion but no clear data structure.
- Easy maths but no use of
math.h. - A single
if.
Be sure to check the antepenultimate line of code.
Missing Features
Color control
Cell colors are chosen randomly (with a questionable rejection scheme). It might have been useful to input them along with sites coordinates, turning the application into a puzzling graphics engine.
Site labelling
The points are implicitly numbered in the order they were entered (starting at one). This can be overridden however, via a simple XSL transformation.
Site radius
The site radius is hardcoded in the code, I still wonder why I did not design it as a function of the underlying cell’s area (which can be averaged for free) or at least a command line parameter. Same with the char set, the viewport and potentially every SVG property.
See Also
Example Output

Inventory for 2005/boutines
Primary files
- boutines.c - entry source code
- Makefile - entry Makefile
- boutines.orig.c - original source code
- Voronoi.png - output example
- eqn.png - equation limit for entry in png file
- input.txt - input file used by try.sh
- try.sh - script to try entry
Secondary files
- 2005_boutines.tar.bz2 - download entry tarball
- README.md - markdown source for this web page
- .entry.json - entry summary and manifest in JSON
- .gitignore - list of files that should not be committed under git
- .path - directory path from top level directory
- index.html - this web page


